The Challenge
Create a VW group-wide internal solution to support the procurement departments to analyse and mitigate geopolitical risks and natural hazards to avoid disruptions in the supply chain, and stoppages in the production lines, costing additional losses, by combining VW internal and external data.
Context
Volkswagen wanted to standardise its process across the group to analyse, prevent and mitigate risks regarding geopolitical topics and natural hazard events that might disrupt the supply chain.
In this product we envision to combine external scores from the regions with internal VW data to give VW buyers more visibility about geopolitical risks that could affect their contracted supplier and support them to create future strategies to avoid disruptions.
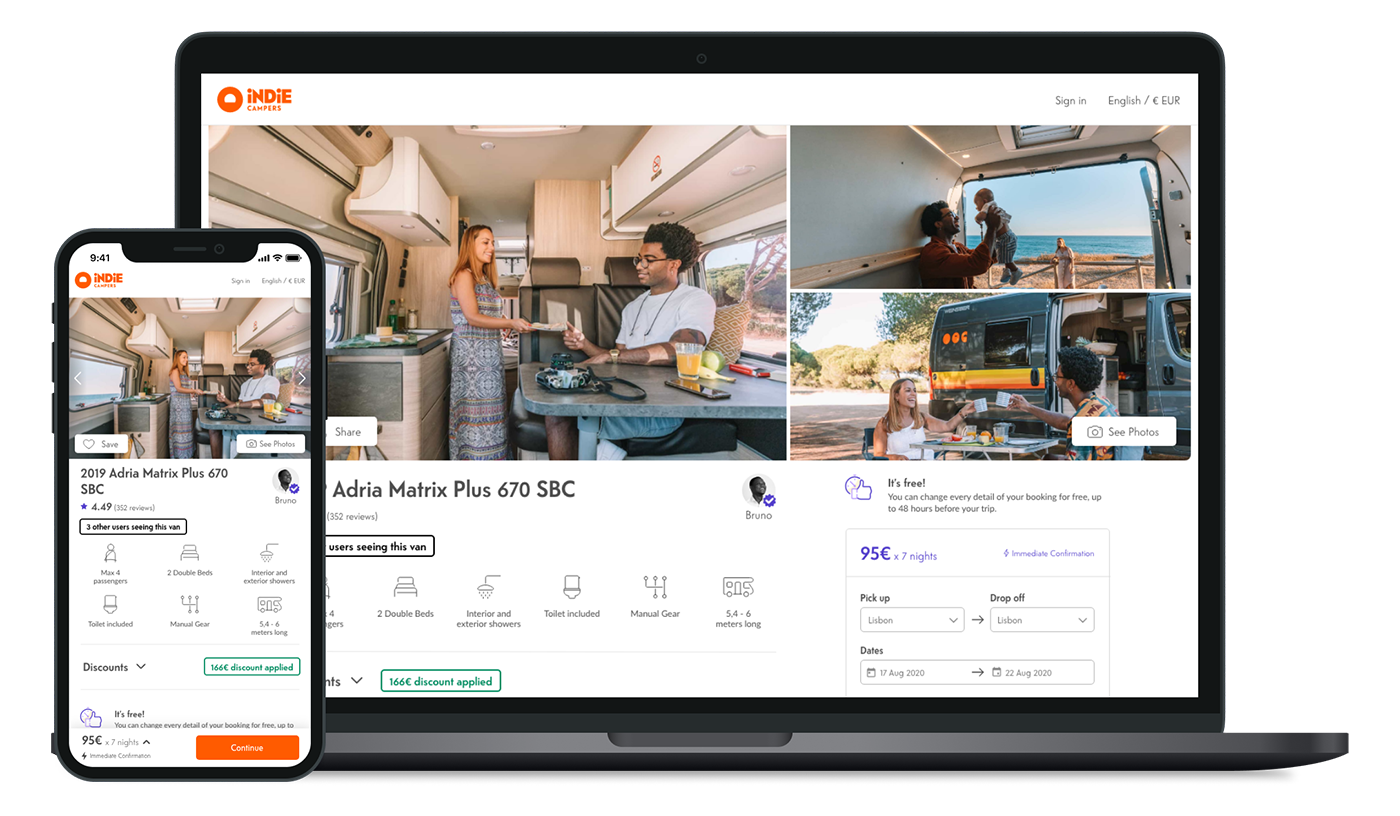
At Volkswagen Digital Solution – an VW group office focused on software development – all roles work in pairs, so I mostly paired, discussed and designed alongside another designer during this product.
Discovery & Framing
The discovery phase is always important in the beginning of a product, especially here as none of the members of the team – apart from the Product Owner – have worked previously in products related to procurement departments or risk analysis.
Research plan and Goals
As neither of us had any experience in such a complex and risky domain, we created together a research plan to cover several points (considering Designer, PMs or developers questions) that we would like to discover and understand from users, processes, internal systems, etc.
In the design aspect of the plan we wanted to understand more about our users, their routines, pain points, needs, most used tools, etc. Then we defined the way we wanted to investigate that information, we decided to interview a group of users and also research about VW internal standard processes.
Interviews
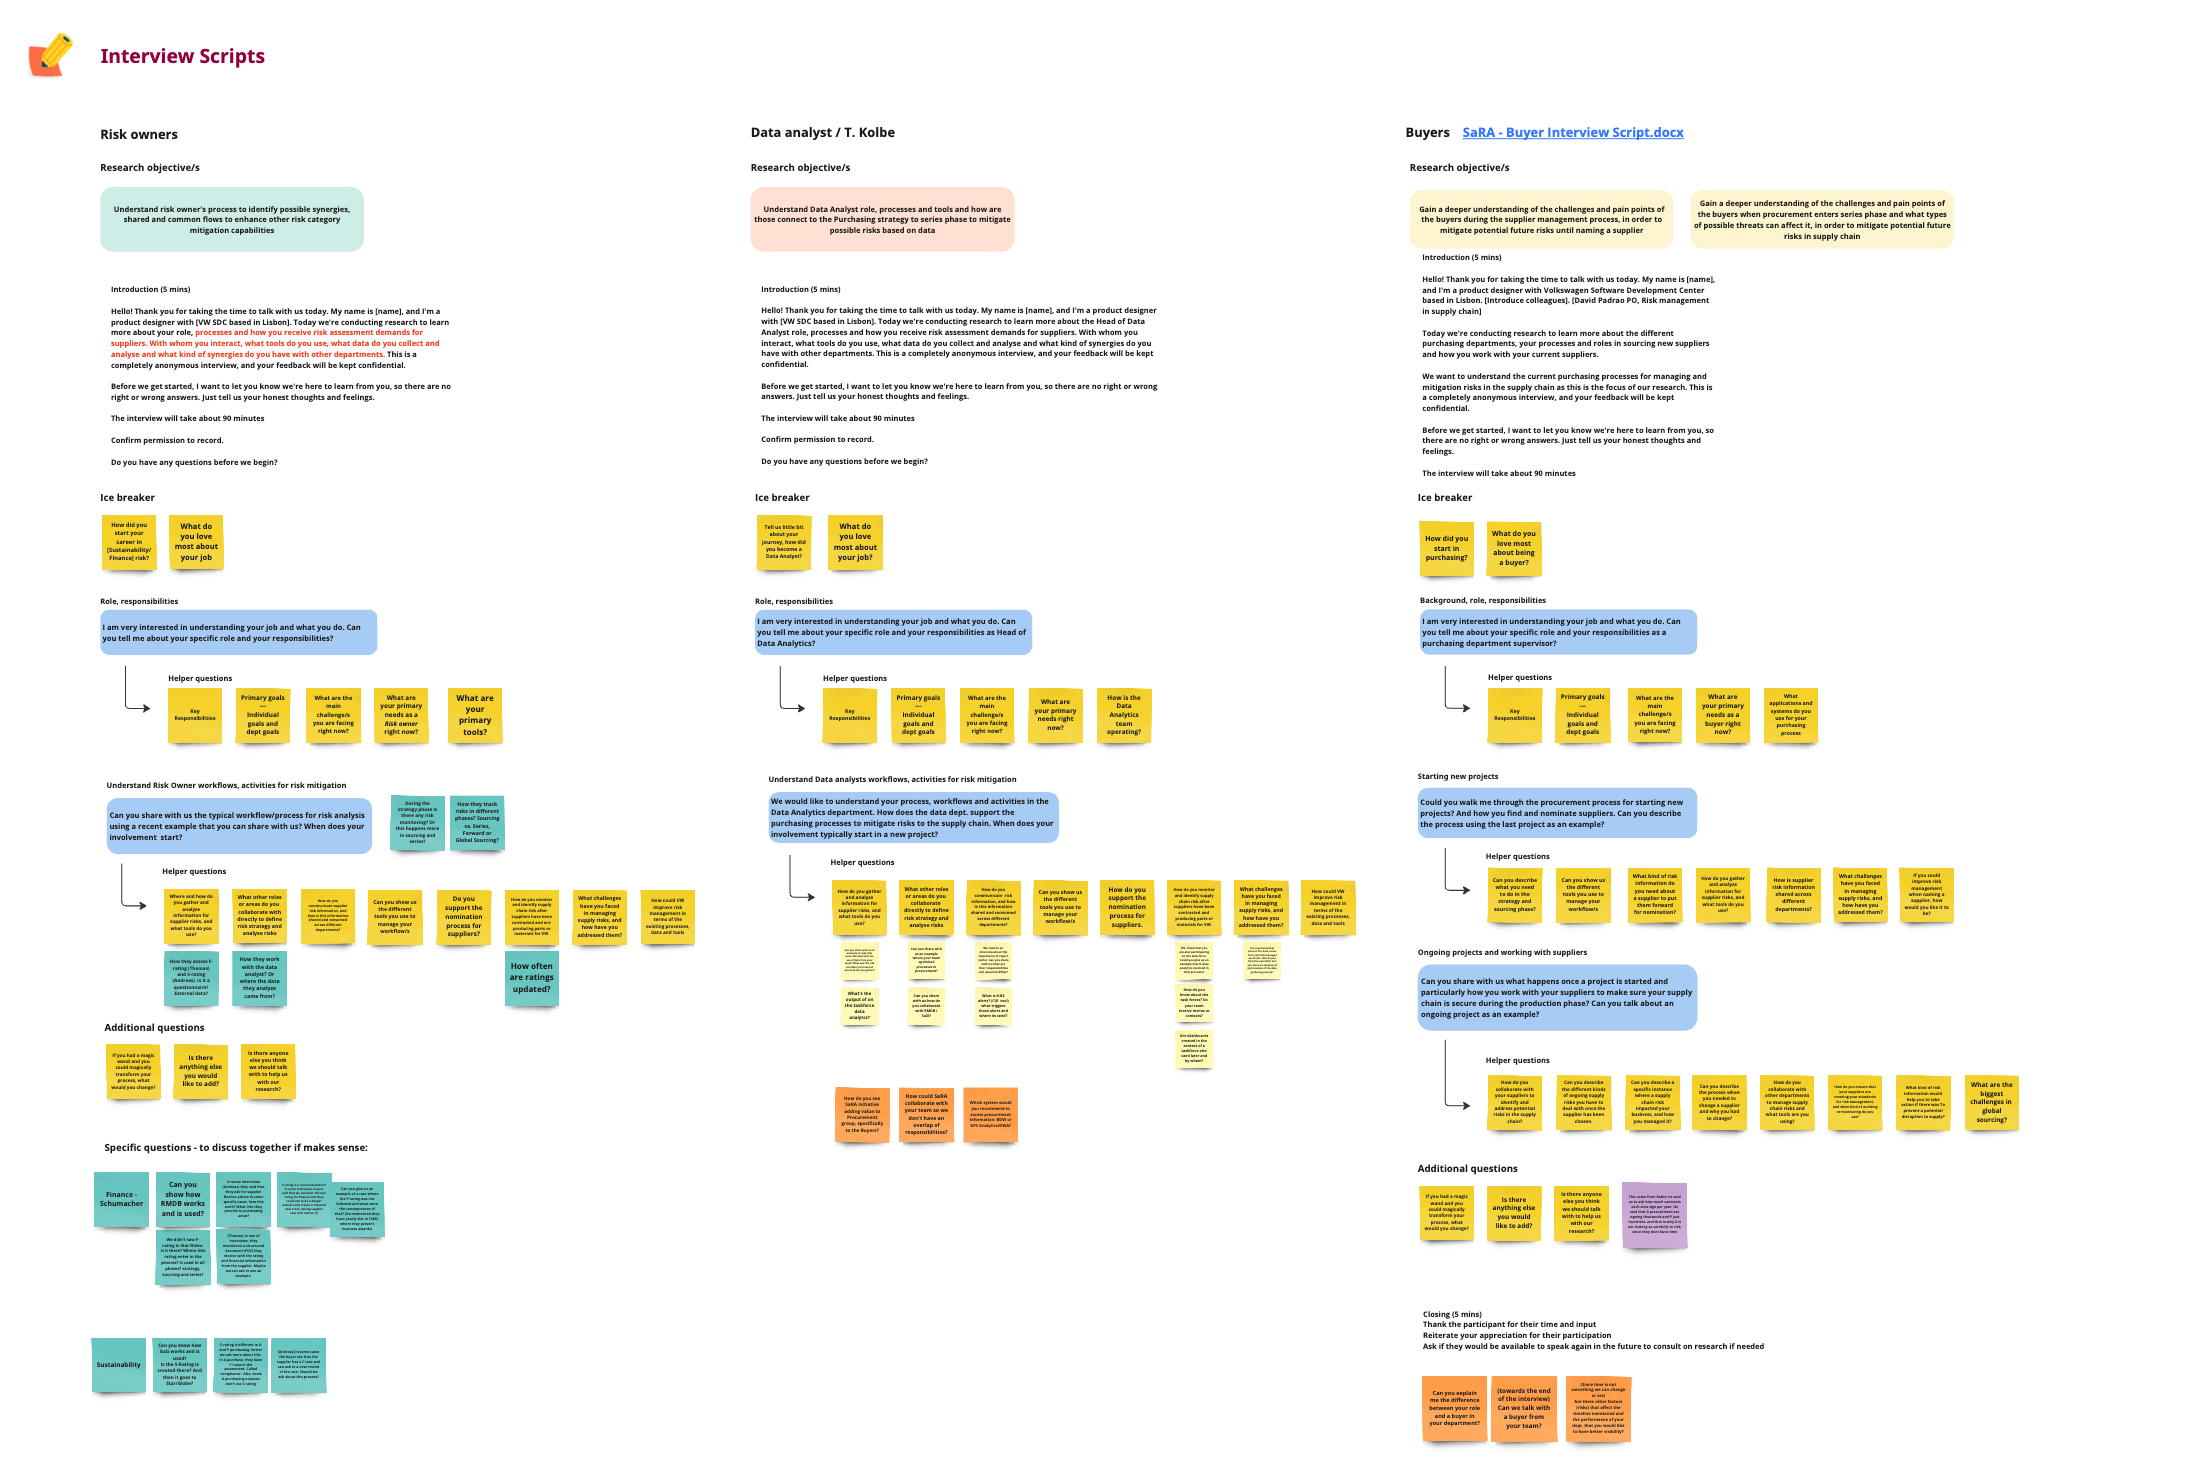
Scripts
As neither of us had any experience in such a complex and risky domain, we created together a research plan to cover several points (considering Designer, PMs or developers questions) that we would like to discover and understand from users, processes, internal systems, etc.
Recruitment
In the VW Group, there are tens of hundreds of buyers, so our next task would be to recruit some buyers to be interviewed. We decided to focus on the most important and critical materials groups for VW.
We also recruited other risk analysts from different departments to get to know about their routines and ways of working within VW.
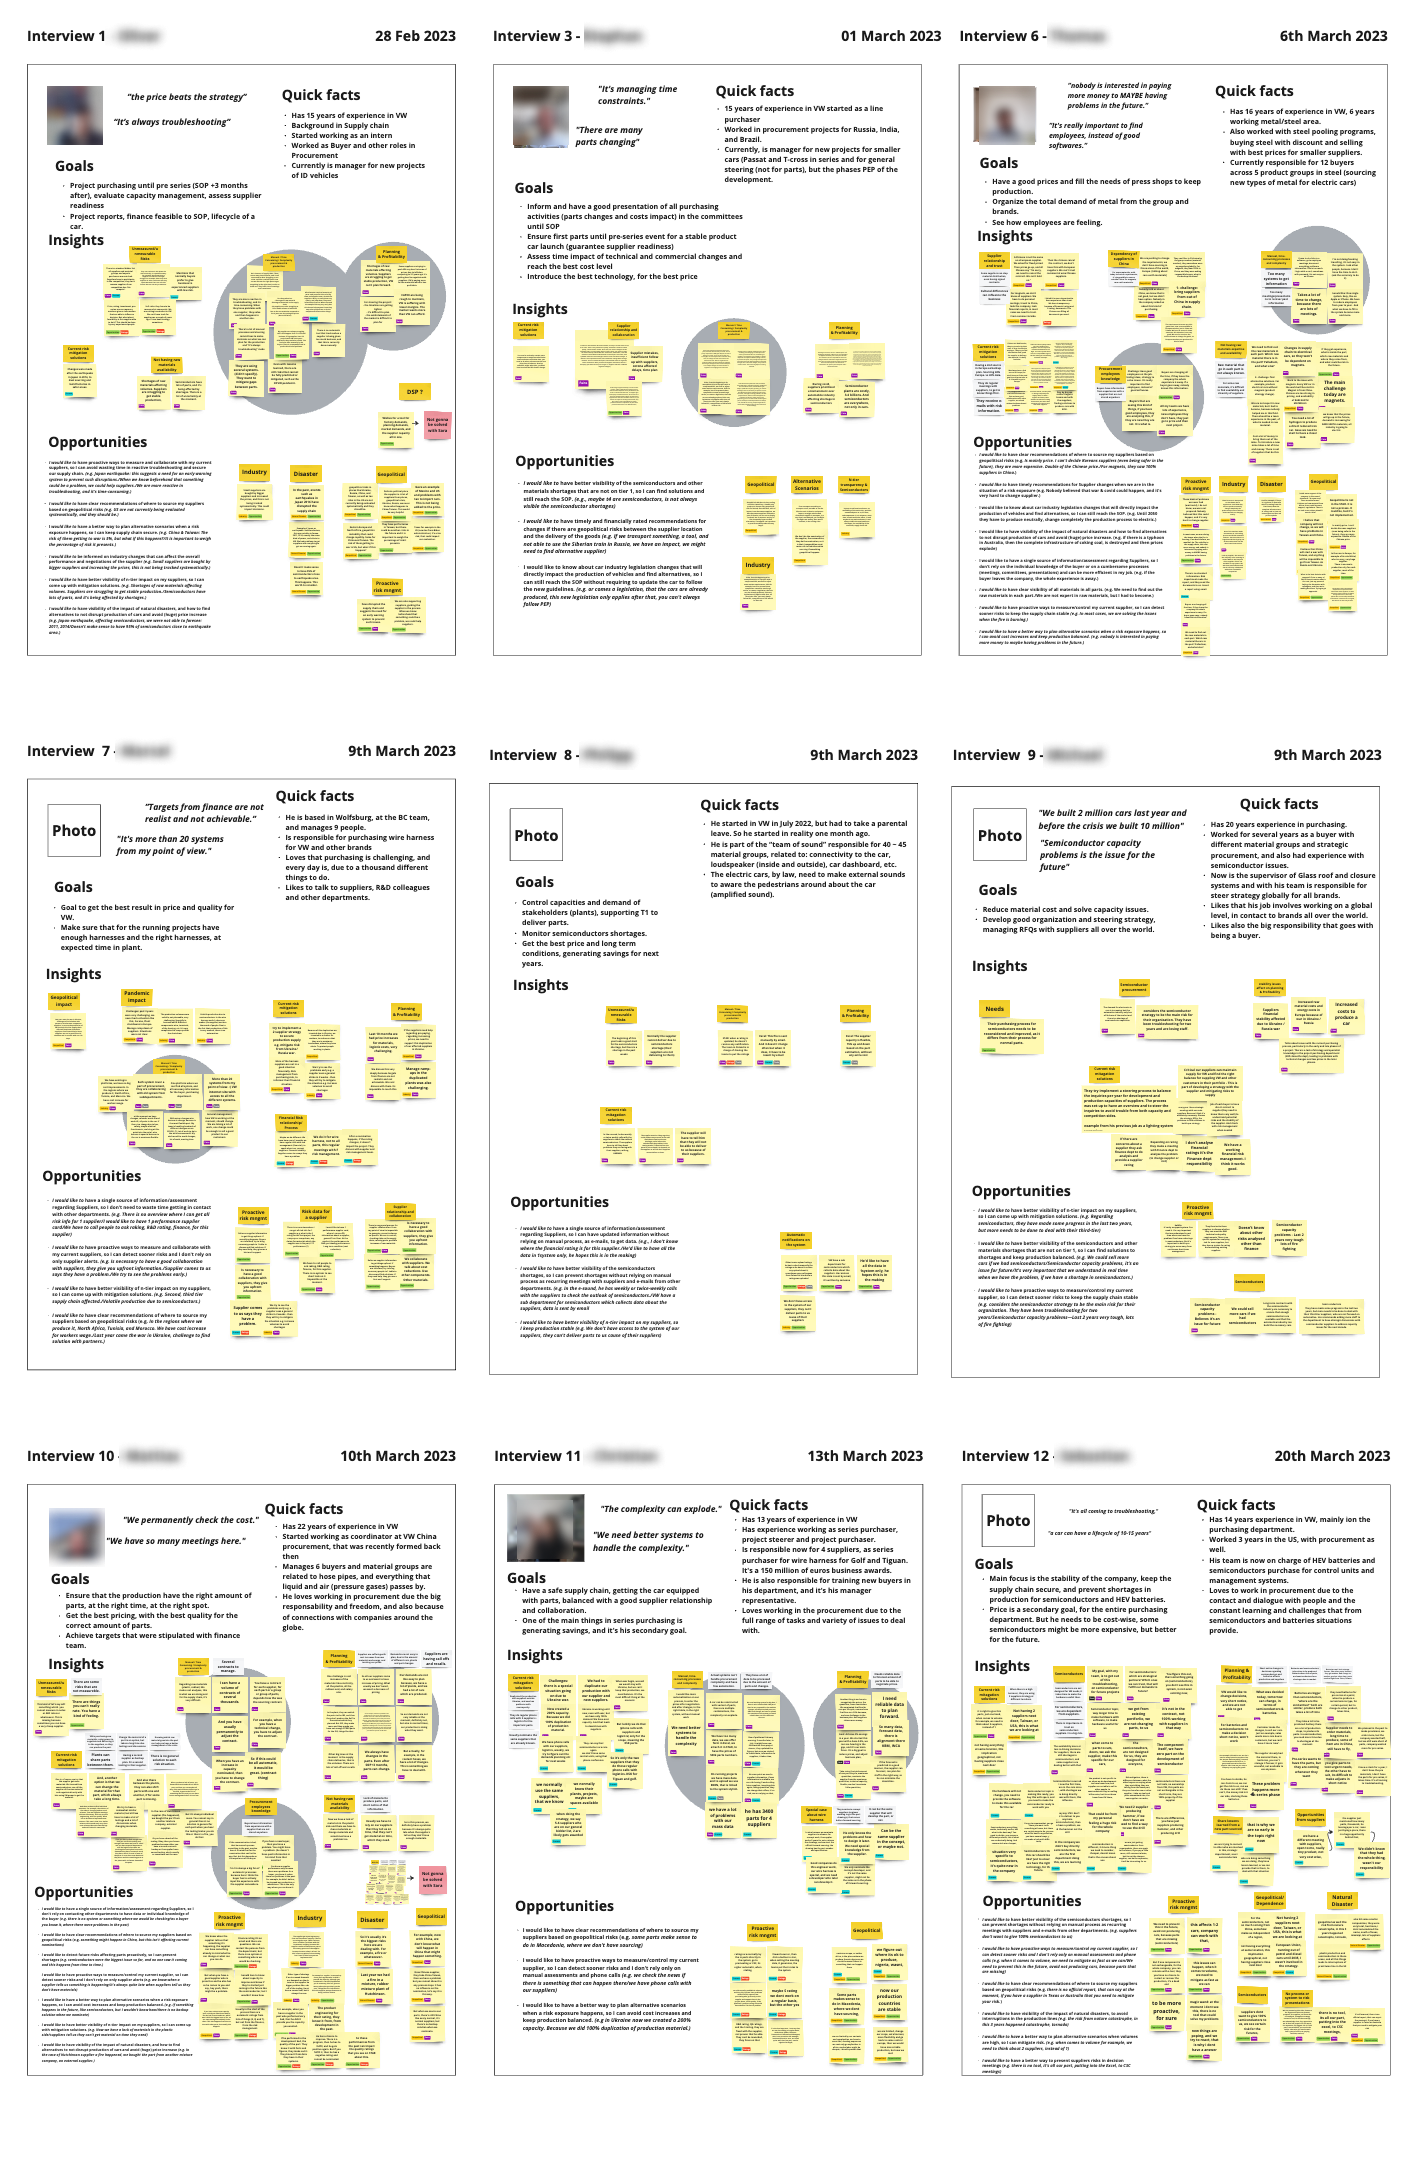
Interview results
At the end, we interviewed all 3 main users of SaRA:
- 20 buyers
- 5 risk analysts
- 1 data analyst
- 40+ hours of interviews
Insights and Personas
We started clustering them by affinity map and later we named the clusters based on the main idea for each of them. Product managers and developers were also researching on their expertises, making it very important to combine our insights with their findings.
We could identify the main “official process” buyers have to follow to select suppliers. We also discovered several aspects they have to analyse to select a supplier: quality of parts, supplier scores, costs, and others. After combining everything, we decided to create one persona for each user.
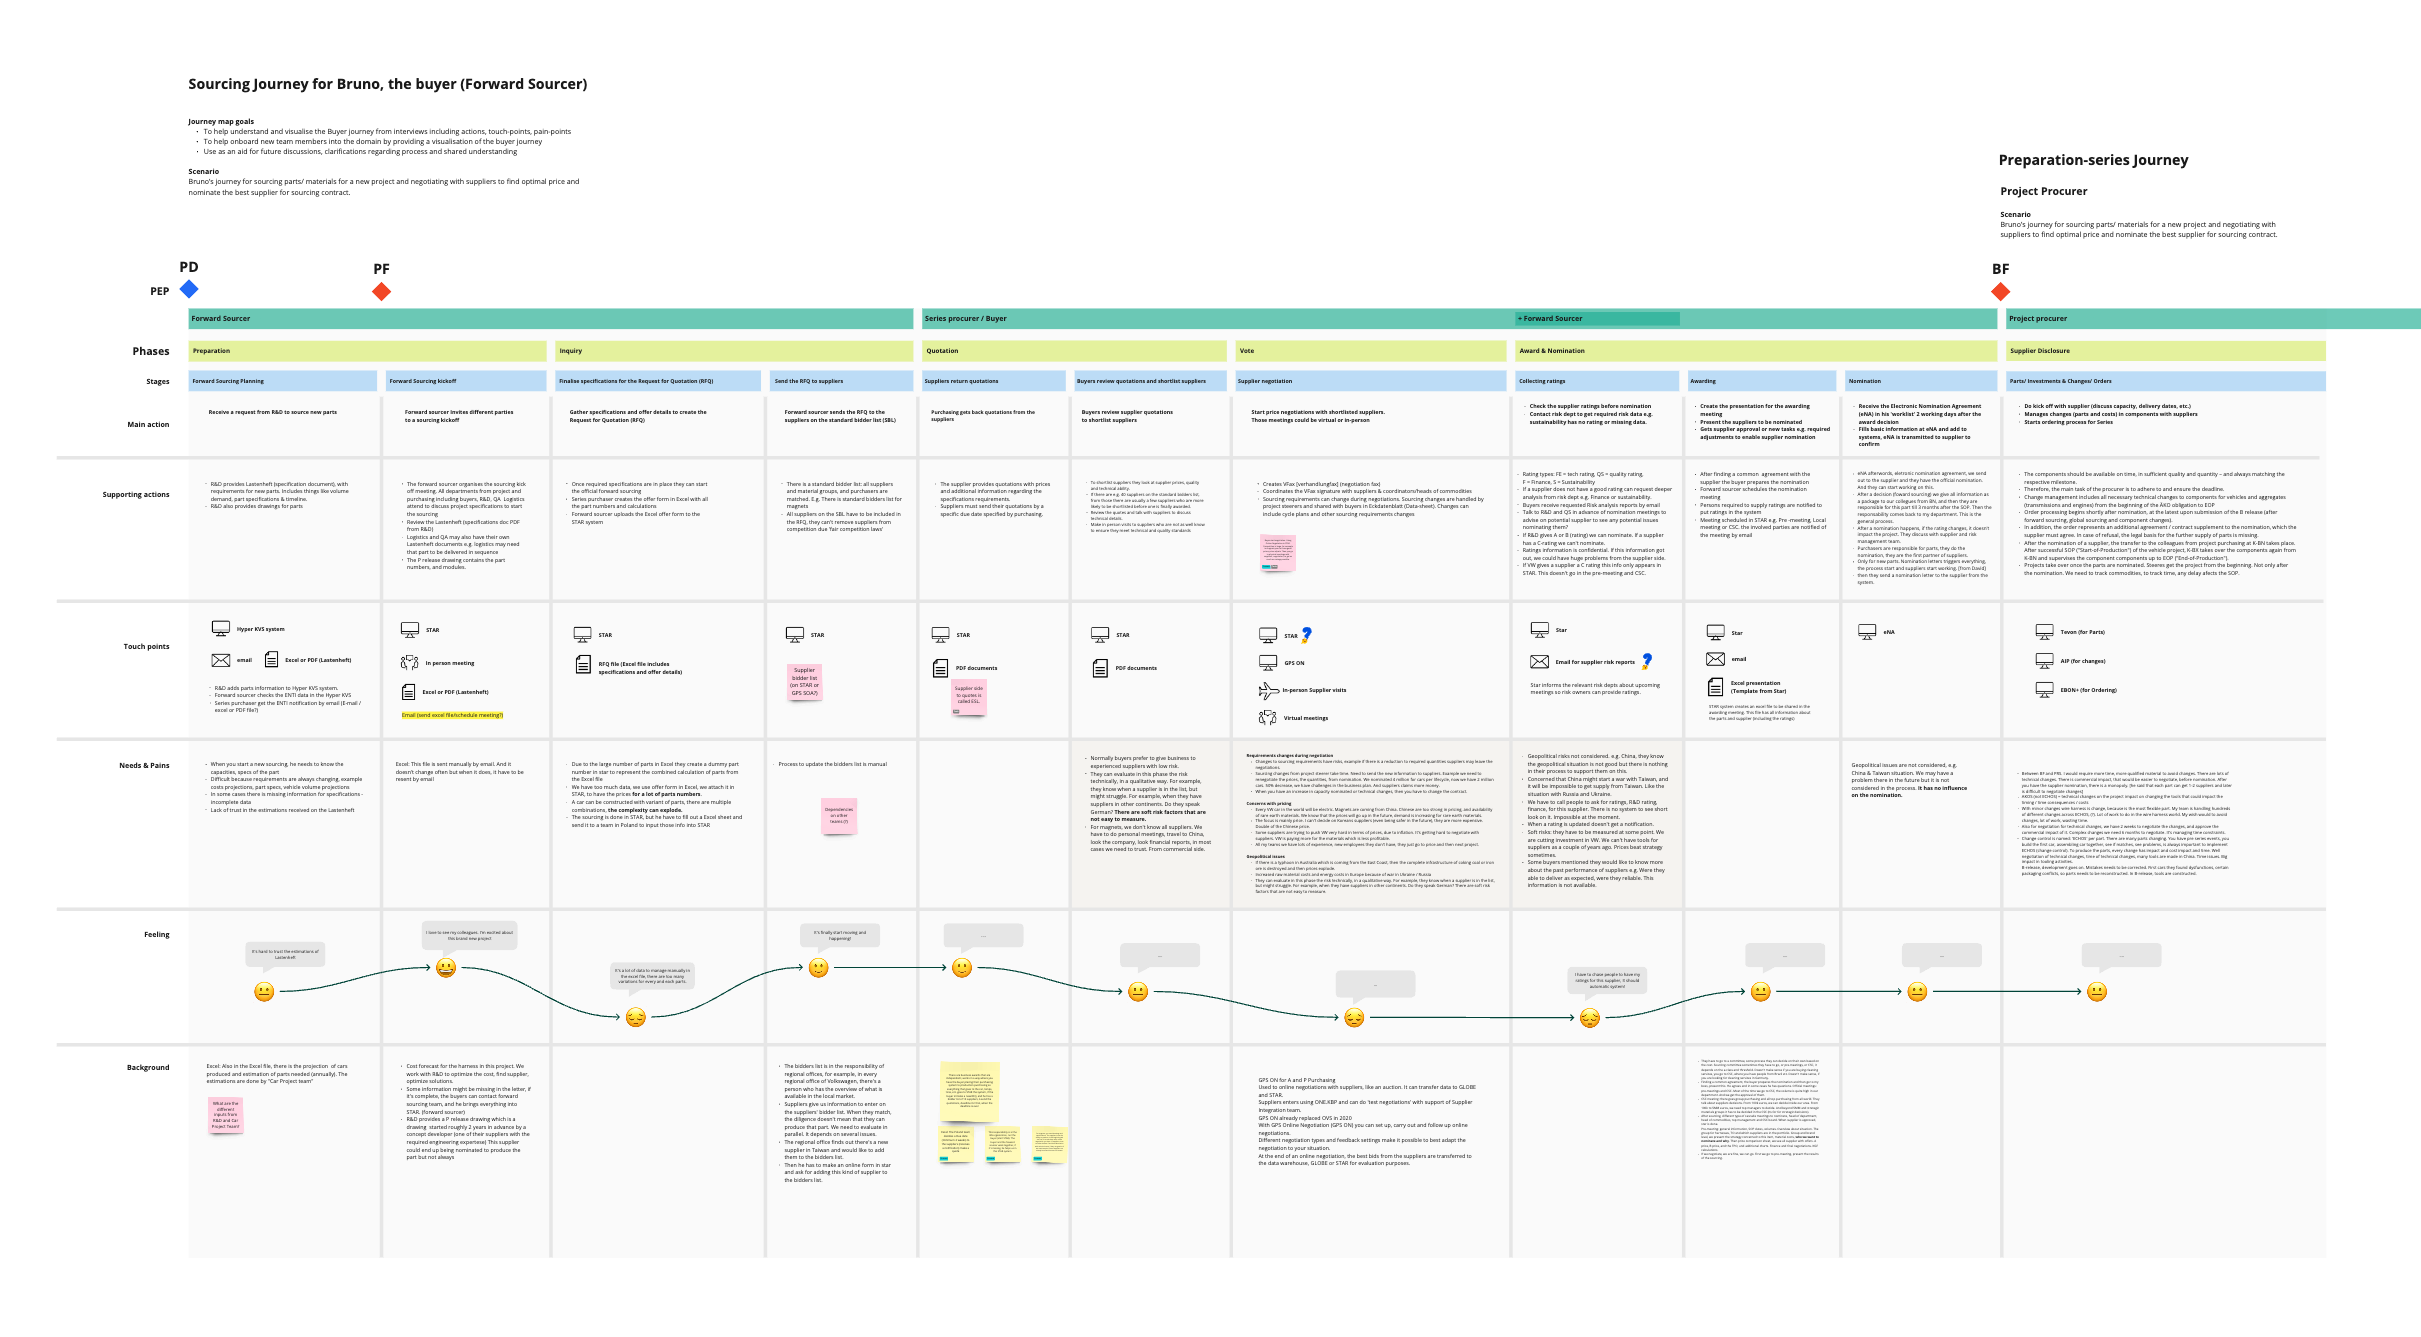
User journey map
Using the same affinity map described previously, I’ve combined them into a comprehensive Journey Map, to visually represent how the current journey the buyers have to go through, from the beginning of a car project to the end of production. This journey would also be also important for future iterations.
- To help understand and visualise the Buyer journey from interviews including actions, touch-points, pain-points
- To help onboard new team members into the domain by providing a visualisation of the buyer journey
- Use as an aid for future discussions, clarifications regarding process and shared understanding
Design & Deliver
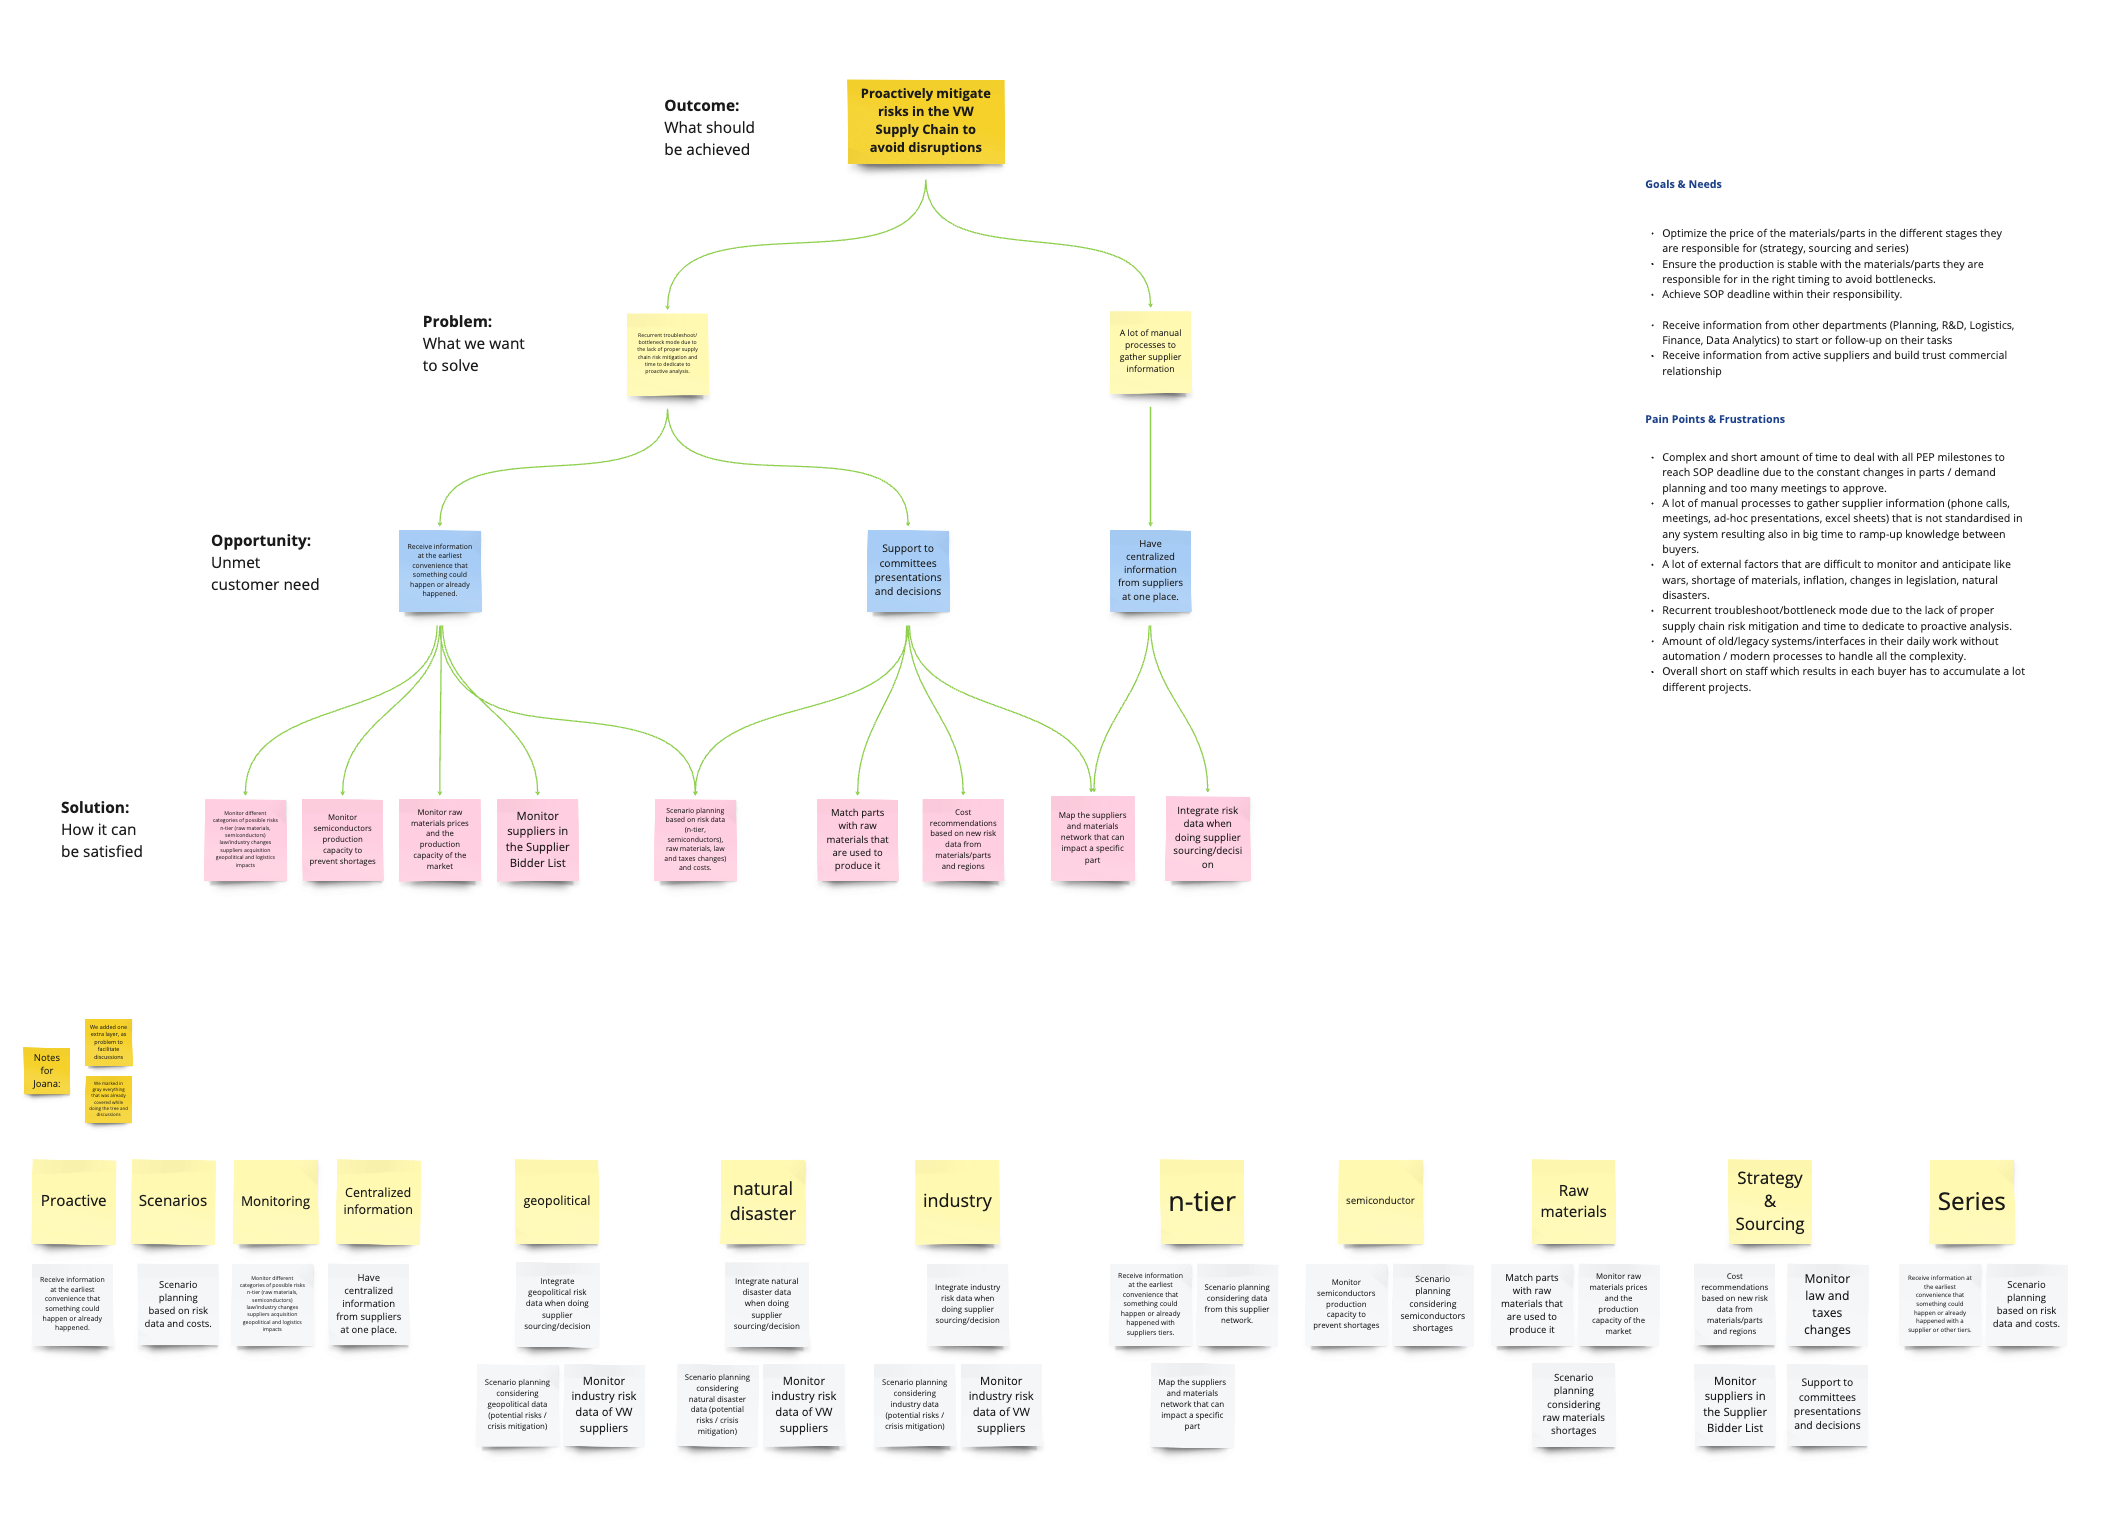
Opportunity solution tree
The OST helped us to generate ideas based on real opportunities we found during the interviews, so they were more realistic ideas.
As we had three main users, we created one OST per user, so we could focus on opportunities separately. Of course, some of the solutions were similar, as the users would have to interact with each other to solve their issues.
Sketching
As the whole team were investigating different aspects around the Procurement department and its processes, me and my designer colleague agreed that it would be extremely helpful to include all members in the ideation and sketching moments.
So, we organised a sketching workshop where everyone could draw the best journey, in their perspective, for the buyers. This workshop was important to listen and include all members regardless if they were developers, product managers, or product designers.
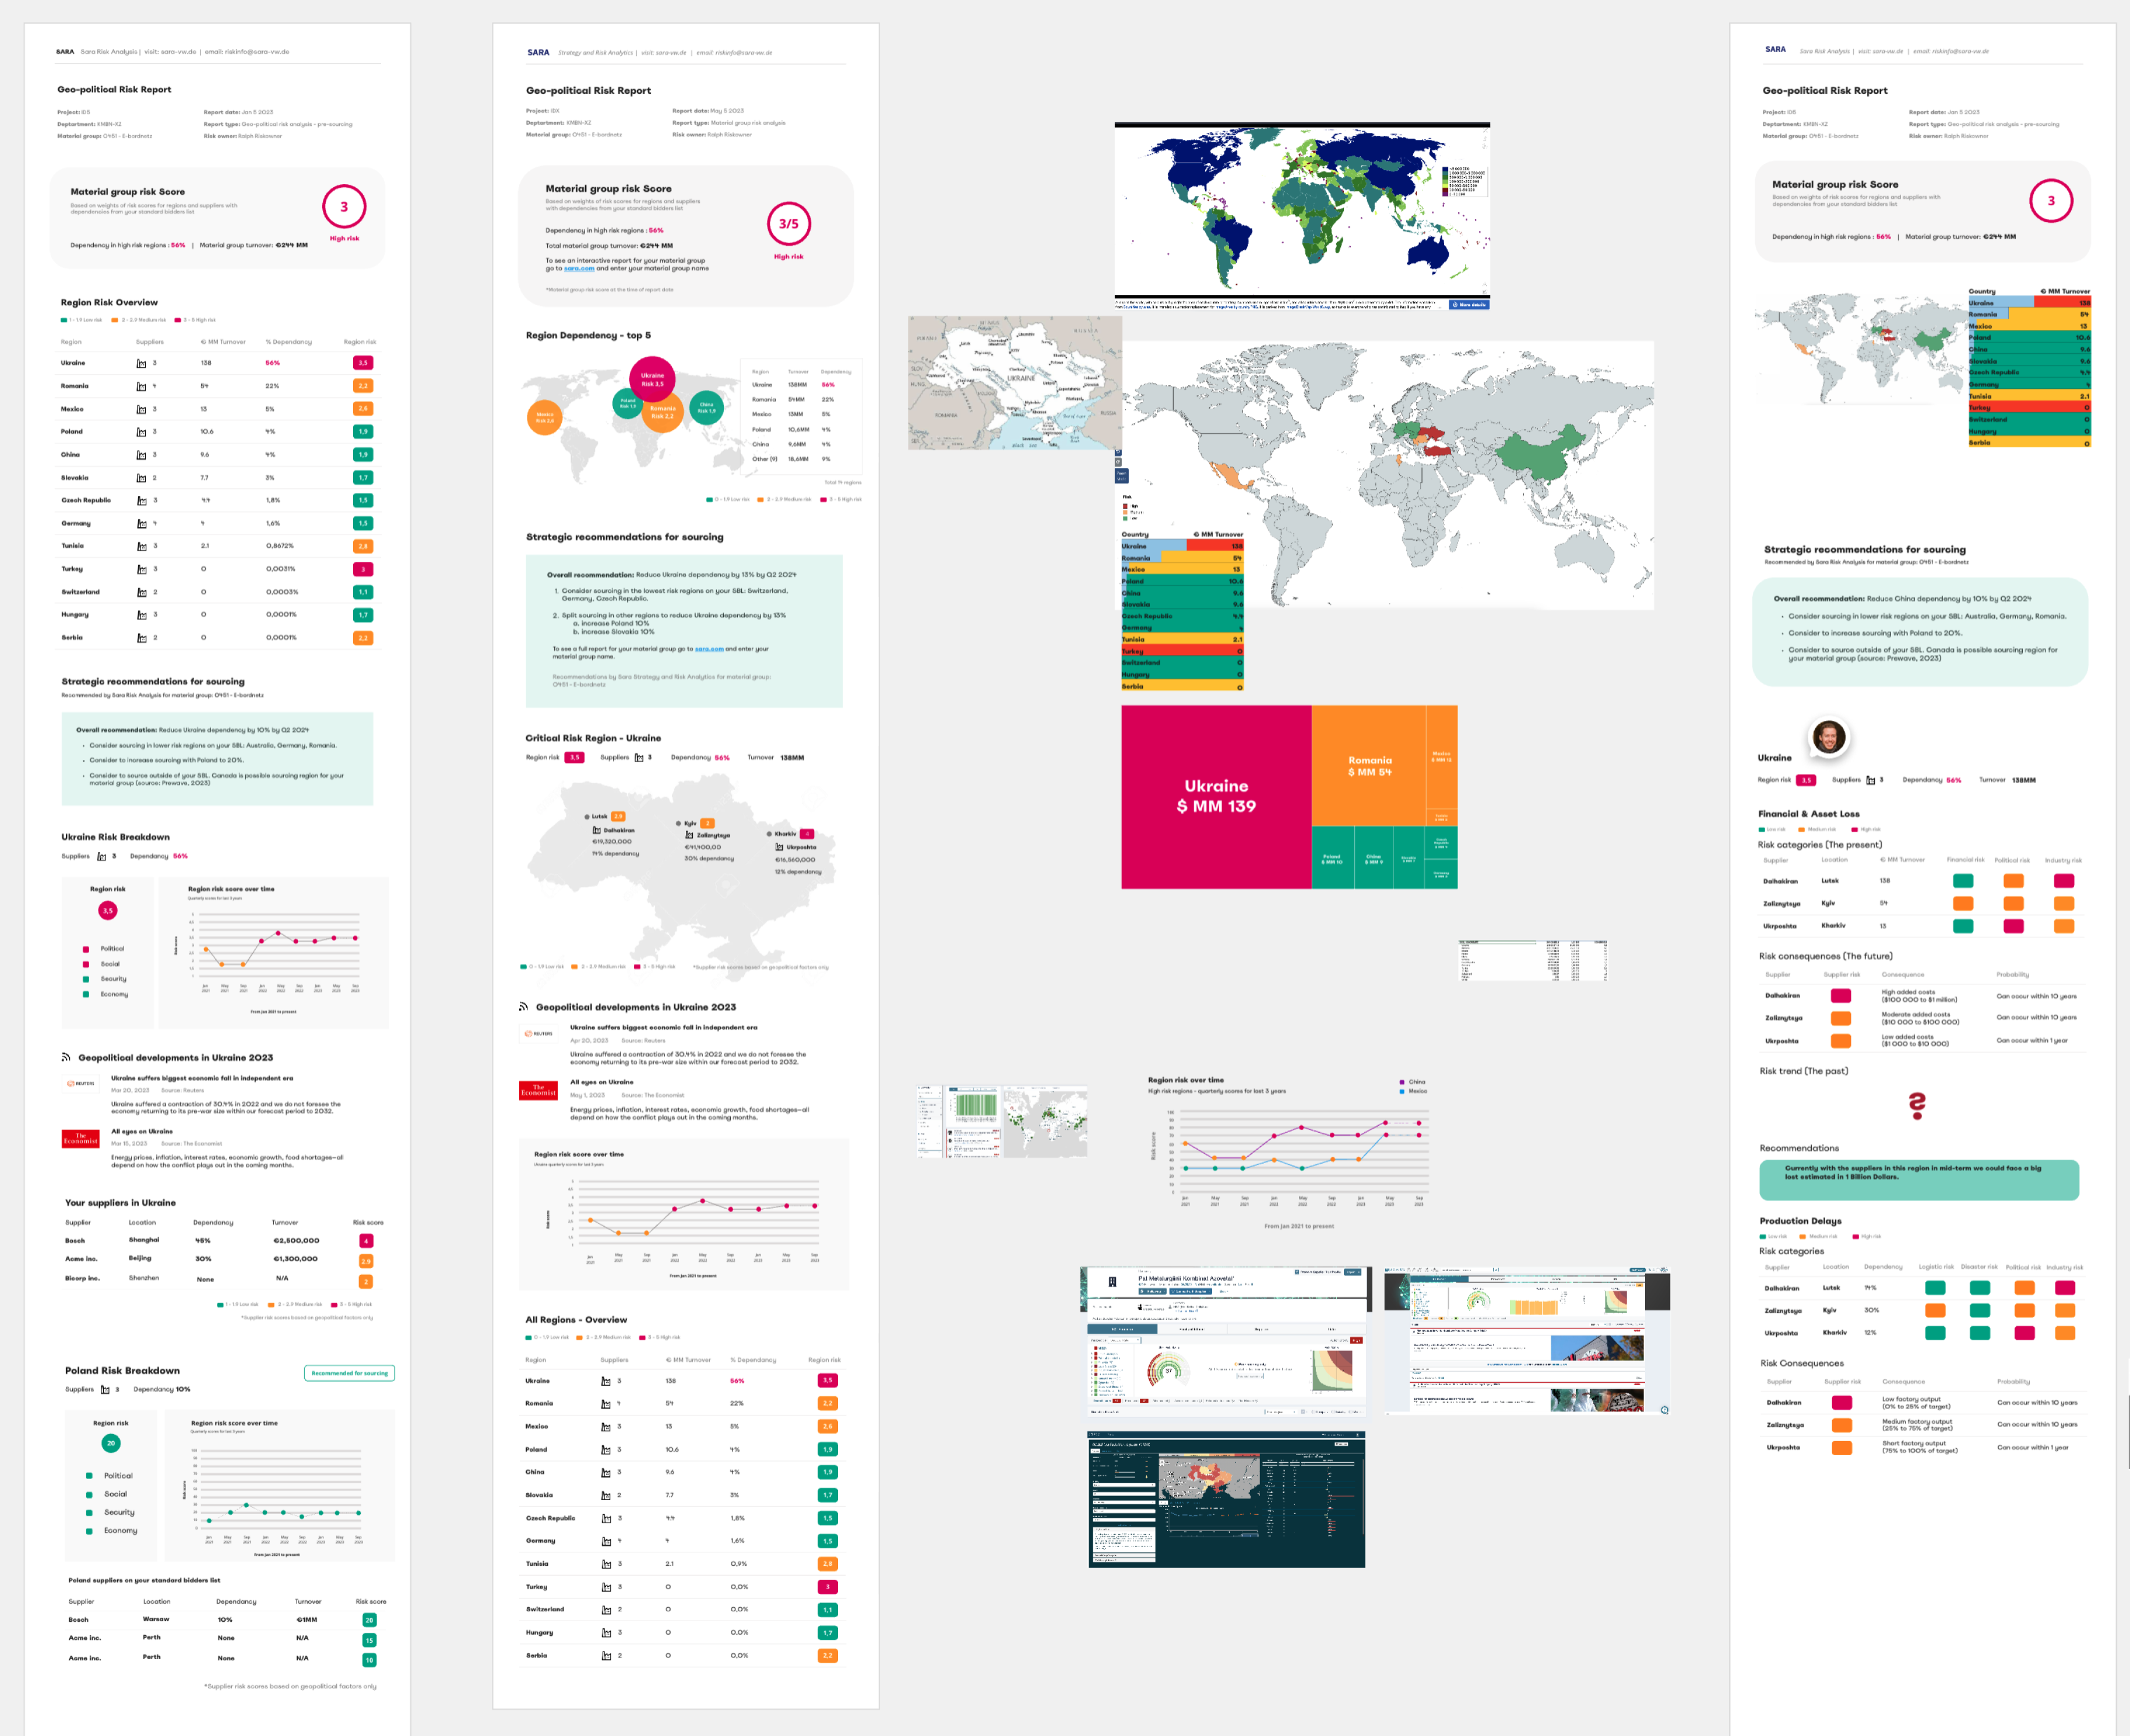
Data analysis and visualisation
I had to collaborate closely with developers to generate the spreadsheets I wanted to analyse. I also worked with our stakeholders from Germany to understand what type of data we would have. Understanding the data was crucial for me to be able and comfortable to create data visualisations to support our users.
Prototyping
We started refining them into a single flow, considering all different approaches each team member had. Here we had an important challenge to tackle: How to present to VW buyers the general score that the Risk Analysts and Data Analyst created to assess geopolitical risks?
We explored several score scales and formats: scores from 0 to 100, C- to A+, “High Risk” to “Low risk”. This exploration was only possible because we worked together with those users to understand their work and the data they were producing to be used in the dashboard.
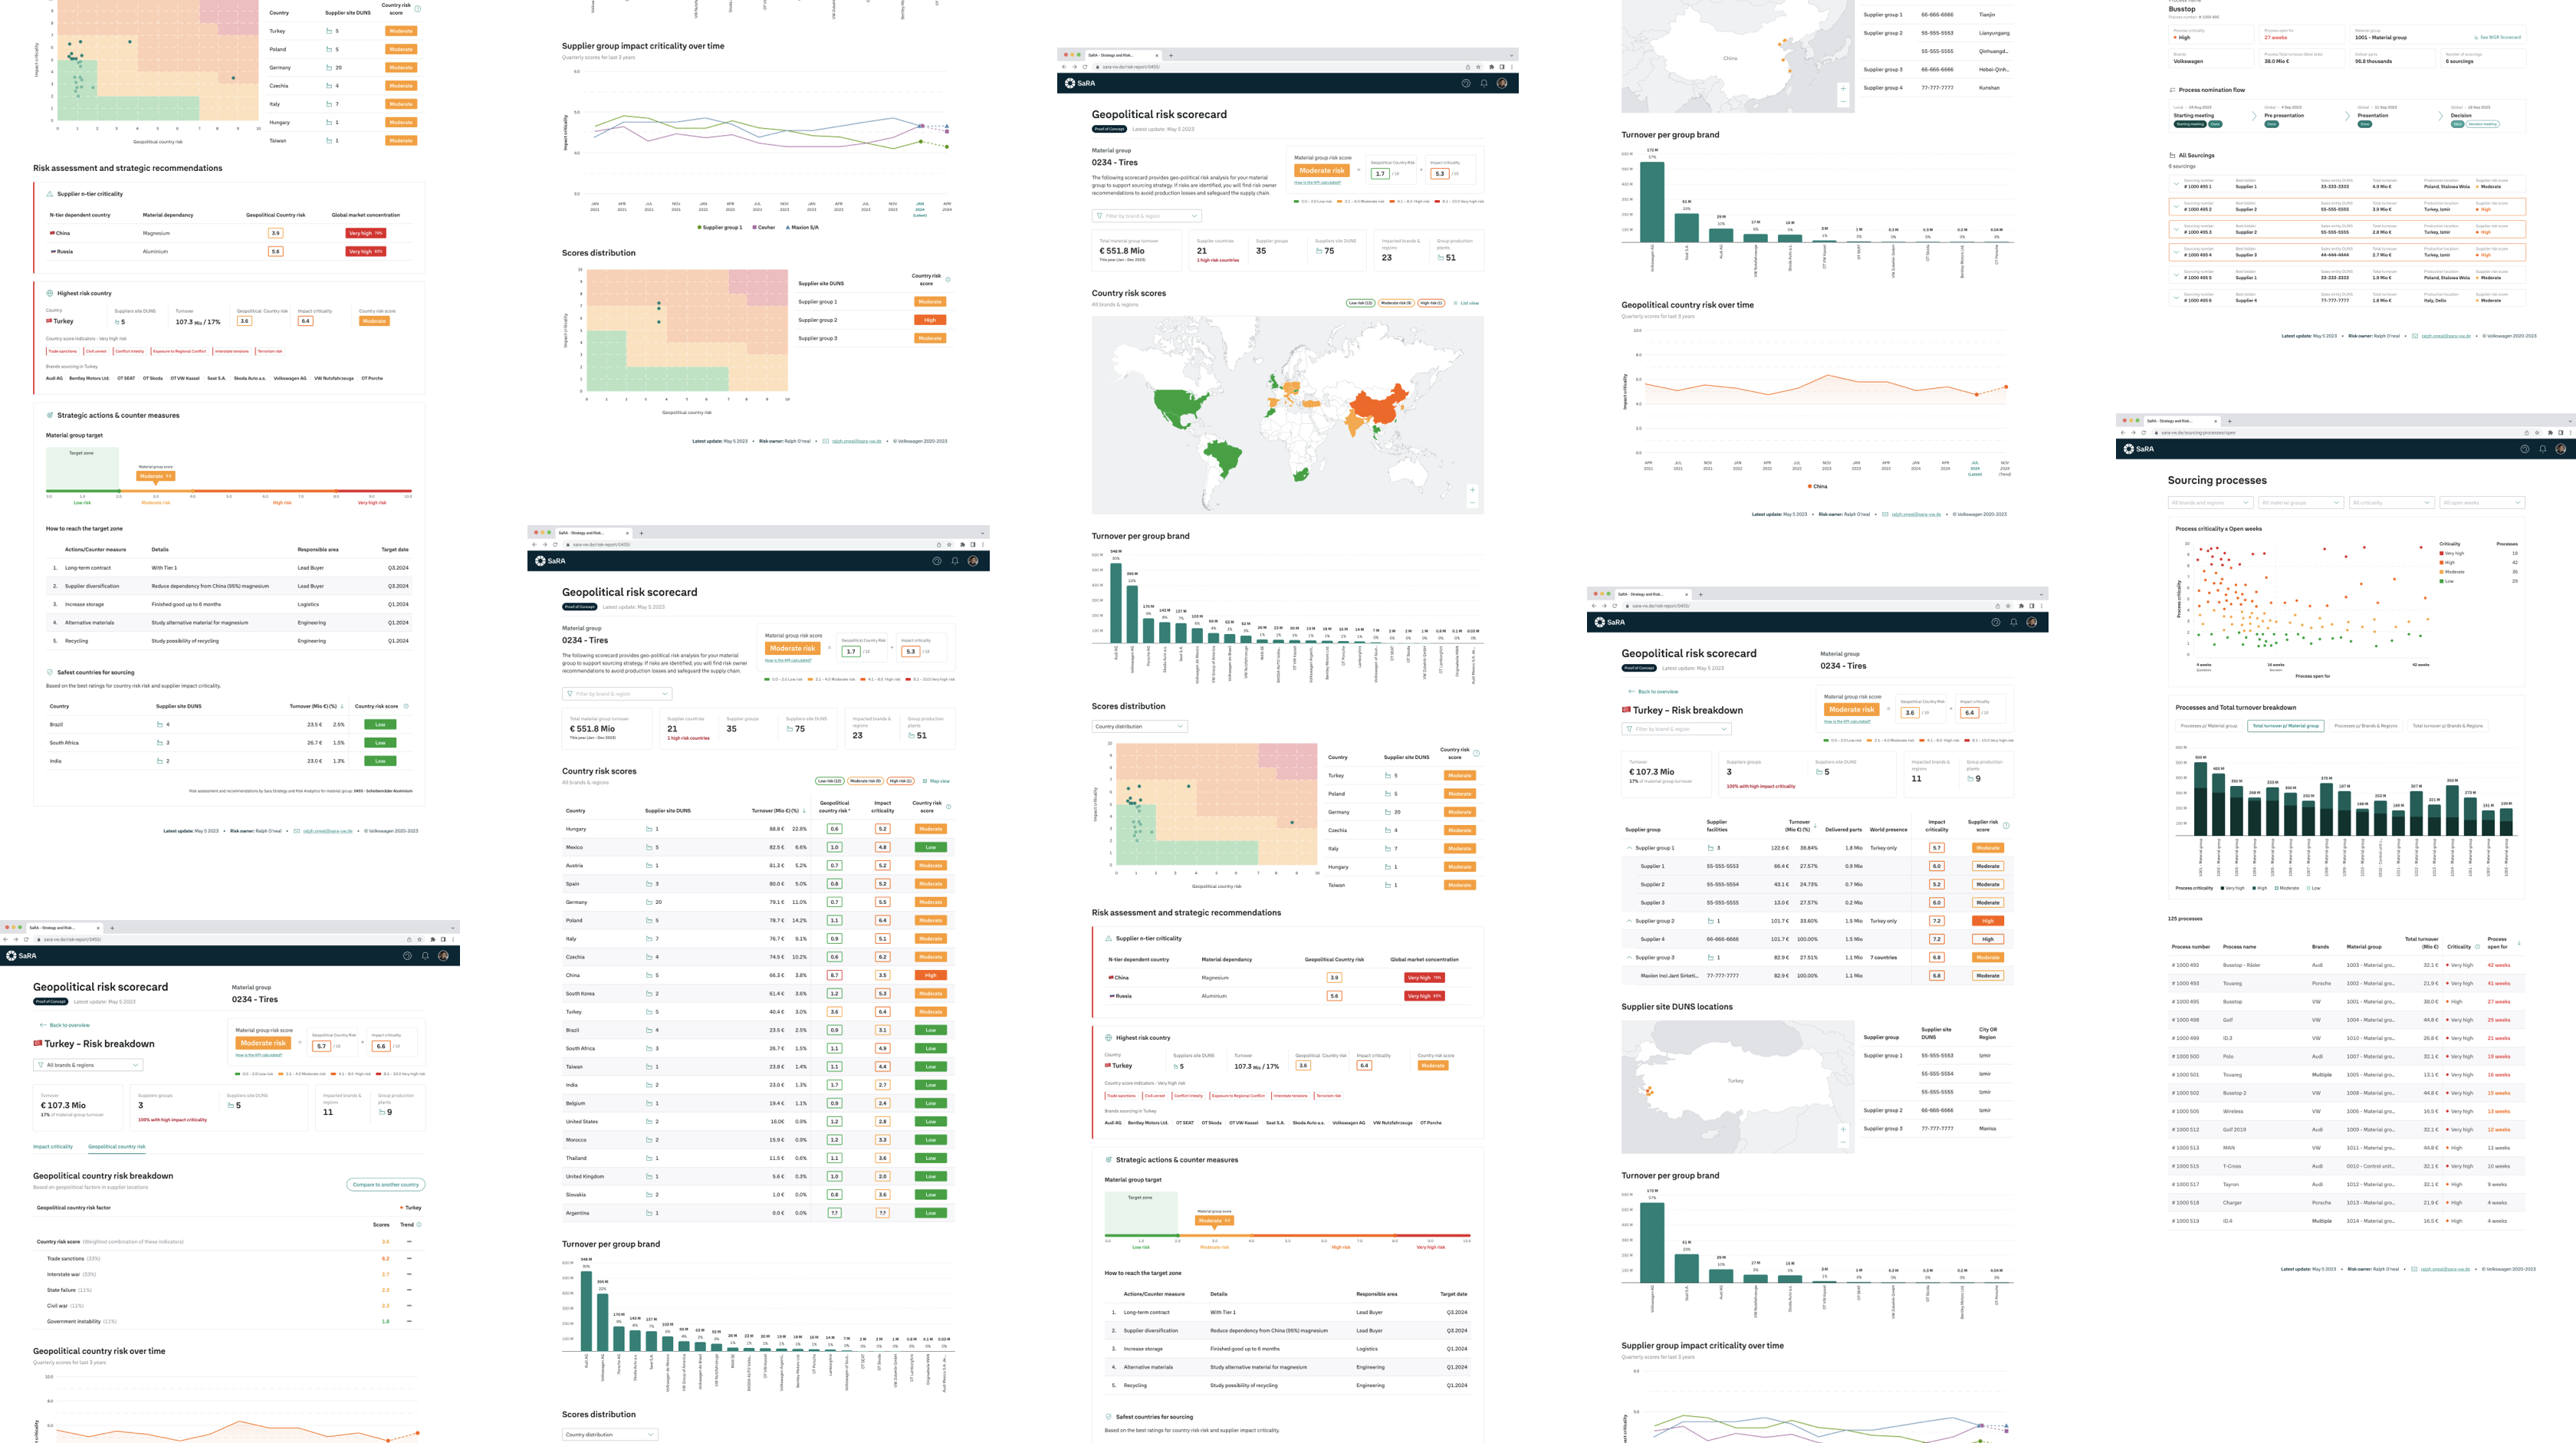
Now, it was the moment we jumped from Miro to Figma. As our product is focused on internal VW employees, we had to use the VW Group internal design system. However, we have to create several components and data visualisations to represent our concepts, because the design system was a simple one and didn’t provide ways to handle data viz.
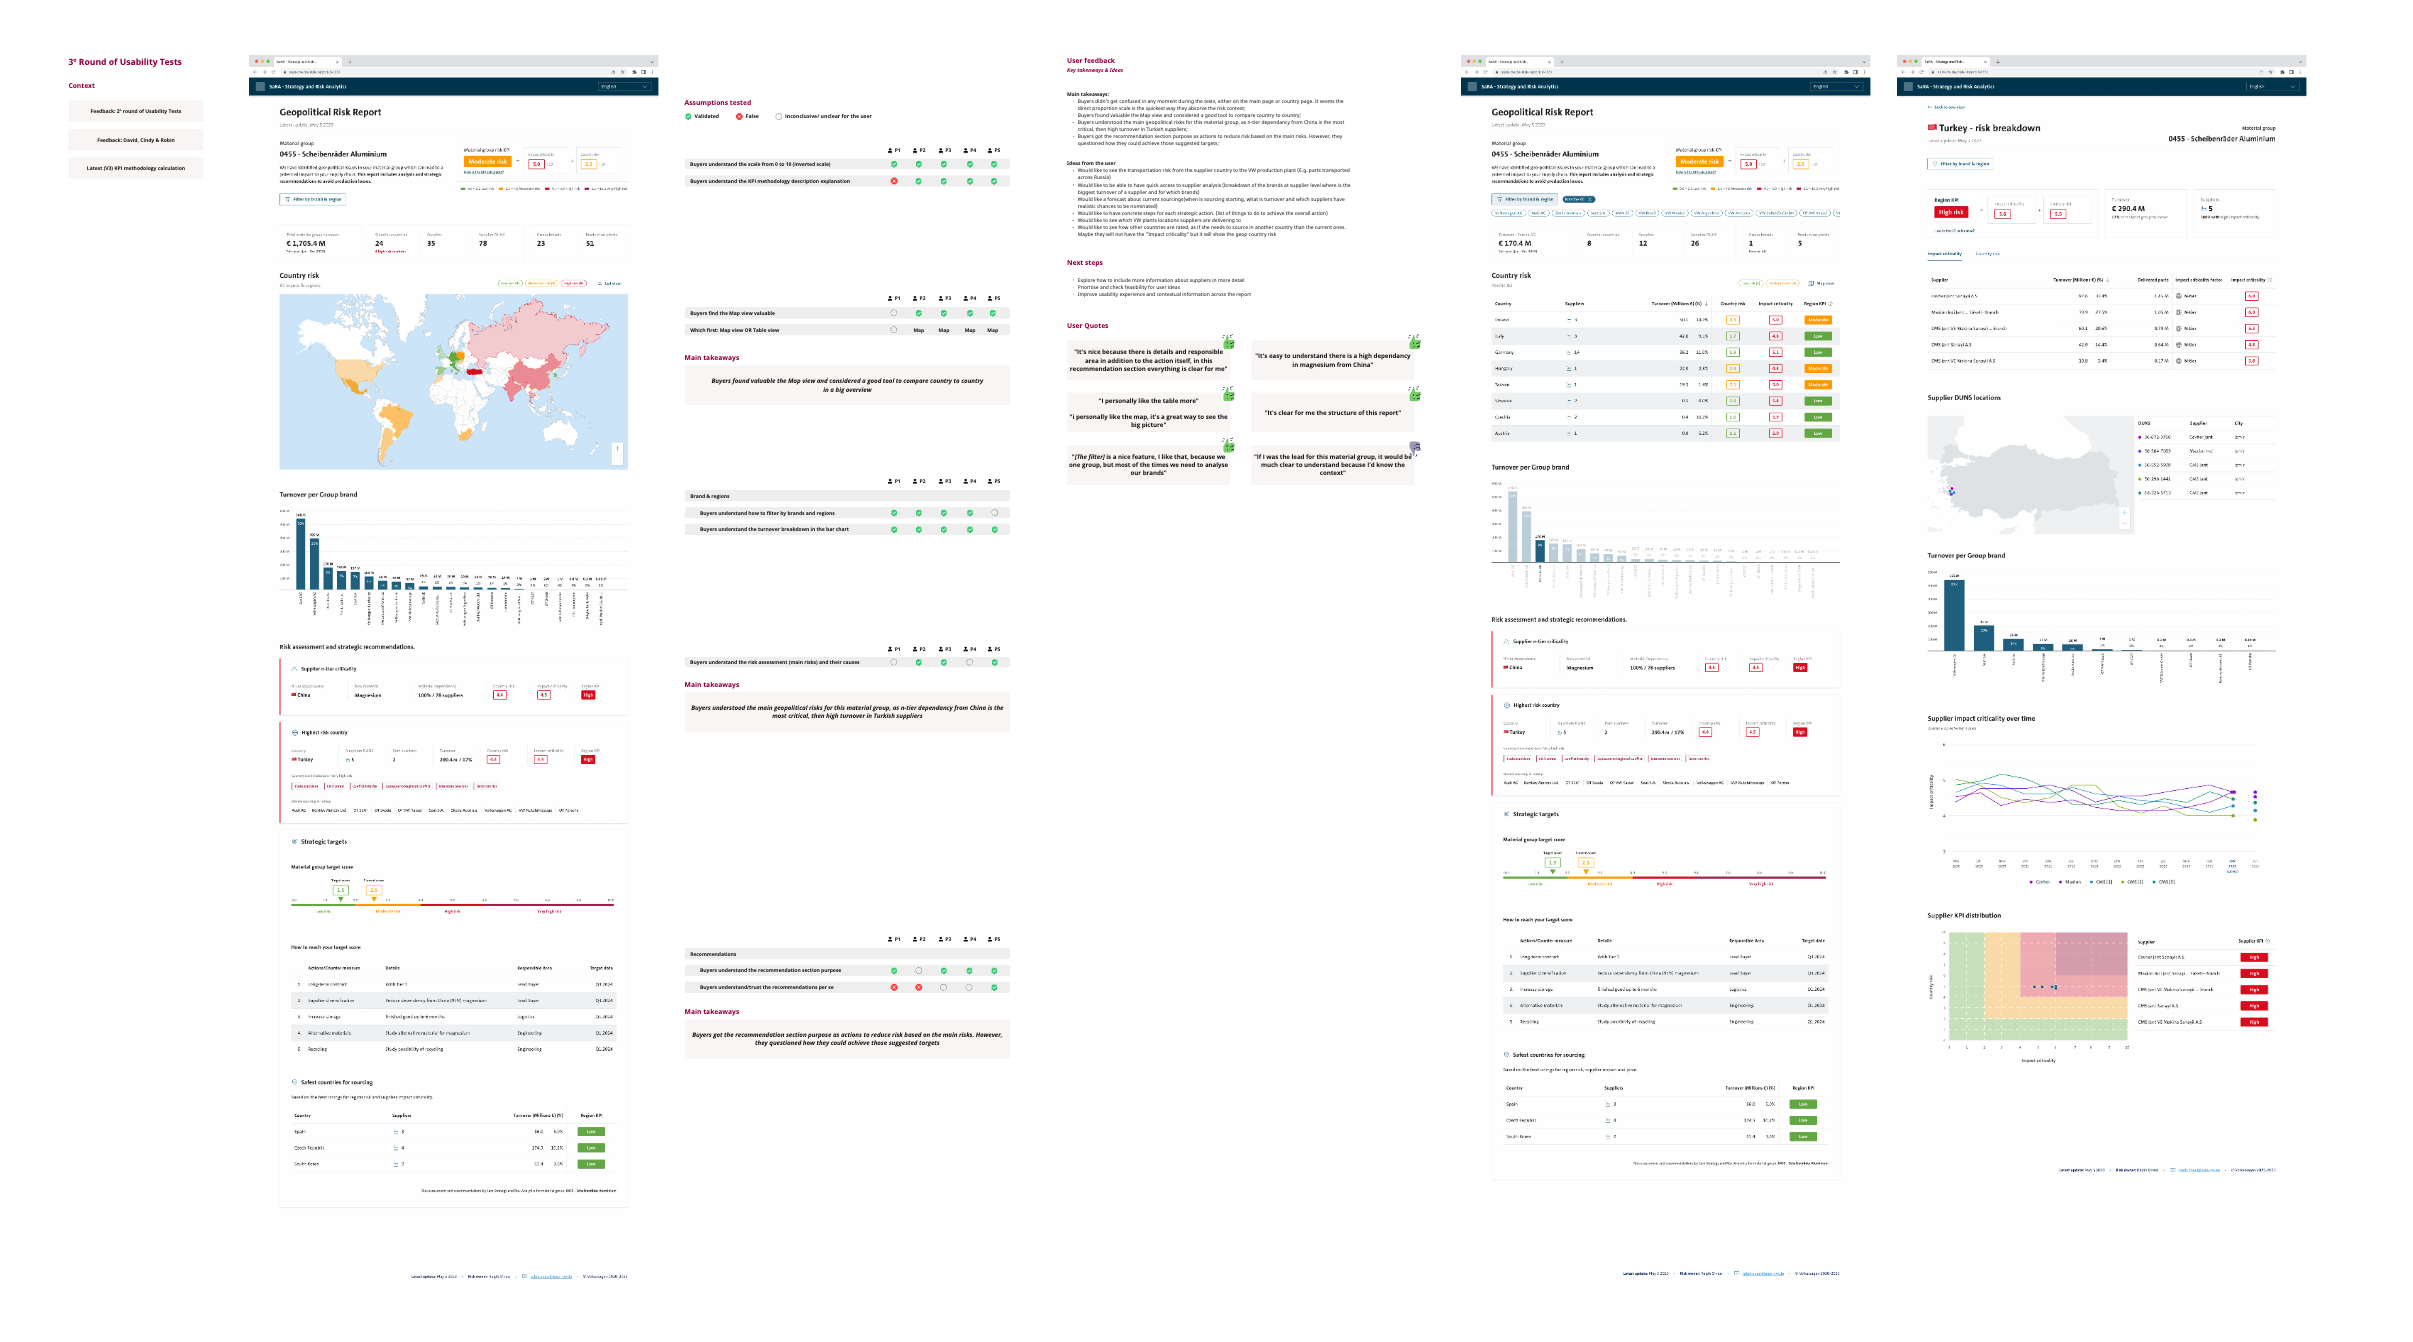
User testing & Critiques
As we iterated our prototypes based on feedback, we organised more internal design critiques and user validations. After each round of validations, we collected the feedback, improved the prototype and ran another round of validations, in a virtuous circle. We had several rounds of design critiques with our team members to collect small and quick improvements.
After each design critique, we organised an user validation with buyers, where we wanted to test their general understanding over the dashboard and the intended message we planned for each data visualisation.
At the end we had:
- 3 rounds of user validations
- 5 users in each round
- 15 buyers in total
- 15+ hours of user testings
Results
After lauching our MVP, we had:
- 16 material groups covered in 2023
- 160 buyers in the procurement department using SaRA
- 17 Risk analyst & 1 data analyst